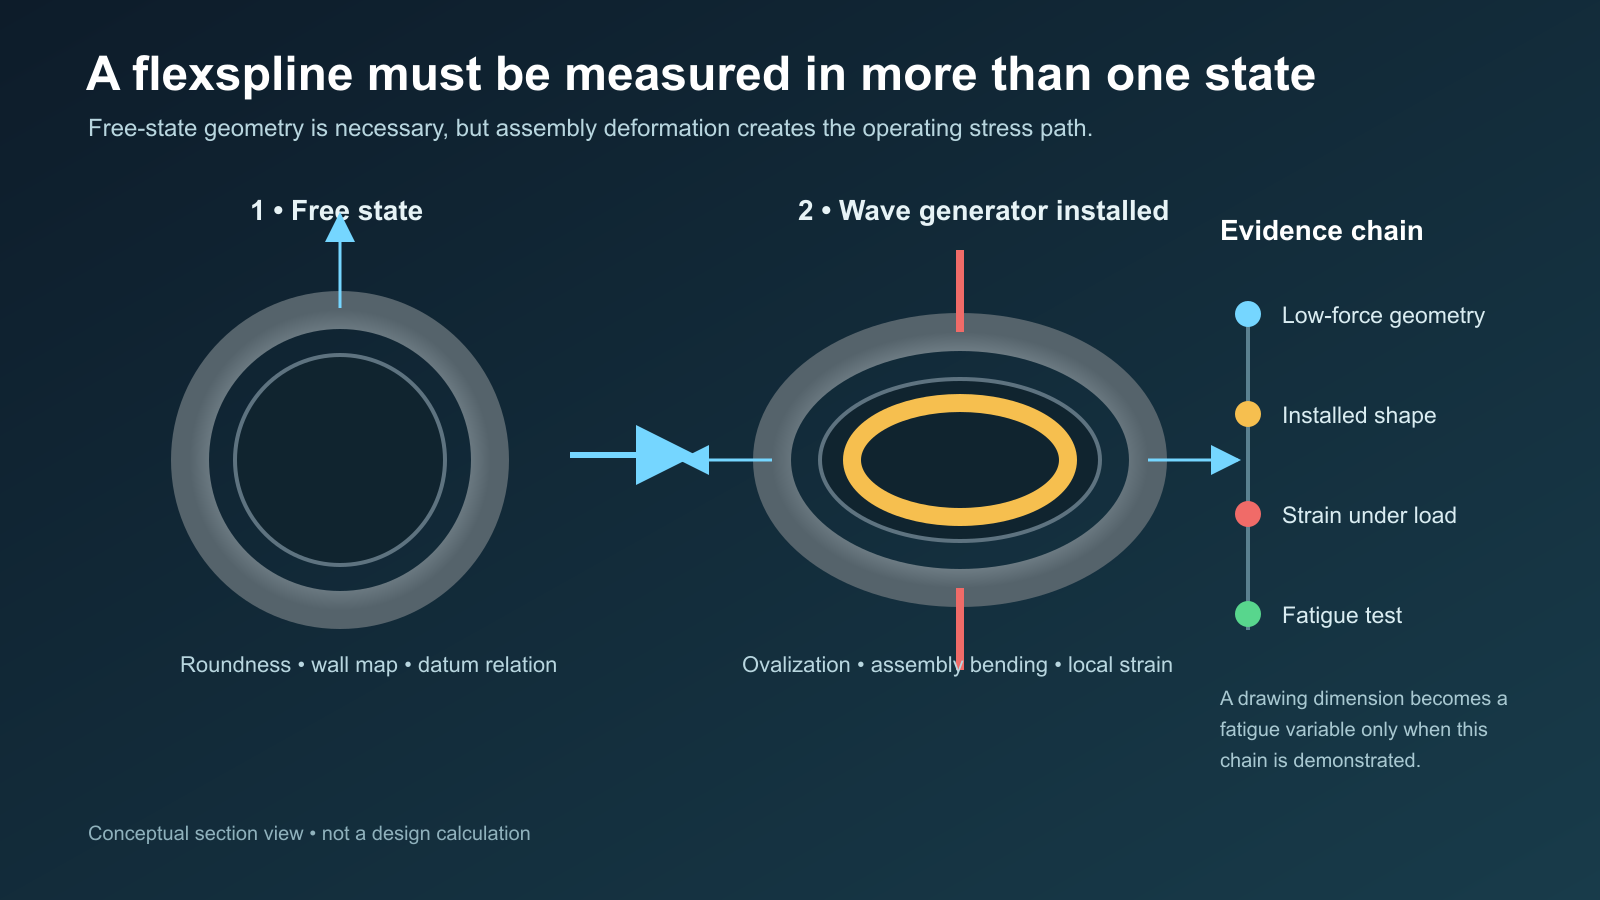
Answer first: A cup-type flexspline is not a rigid gear that merely happens to have a thin wall. The wave generator forces it from an approximately round free shape into a rotating elliptical deformation, so wall-thickness distribution, diaphragm-to-boss transition geometry, rim shape and datum relationships can alter local bending and cyclic stress. A dimensional report in the free state is necessary, but it cannot by itself prove the assembled stress state or fatigue margin. The manufacturing control plan must connect three kinds of evidence: low-force geometry, installed deformation, and strain or life under representative load.
This article asks one focused question: which flexspline manufacturing errors can become fatigue variables after assembly, and how can that connection be tested? It does not provide a universal flexspline tolerance, material, heat treatment, torque rating or service-life prediction. Those values are design-specific and depend on the complete strain-wave gear.
The operating principle turns geometry into repeated deformation
A typical strain-wave gear contains a circular spline, a flexible externally toothed cup and an elliptical wave generator. Installing the wave generator deforms the flexspline so its teeth engage the circular spline in regions near the ellipse’s major axis. As the wave generator rotates, the zone of deformation and engagement travels around the cup.
That motion is useful because it enables a high reduction ratio in a compact package. It also means that the flexspline is deliberately cycled. A local section that is slightly stiffer, thinner, more sharply blended or differently aligned than intended does not remain a static geometric imperfection; it participates in a moving stress field.
Shuting Li’s theoretical and experimental work on a cup-type flexspline examined bending and shear stresses in the diaphragm and compared finite-element results with strain-gauge measurements. The study highlights the diaphragm-to-boss corner as a characteristic fatigue location and proposes stress-based fatigue evaluation. Earlier Japanese research also investigated stress in flexible splines using analysis and strain measurement. These studies do not establish a machining tolerance, but they show why the manufacturing drawing must be connected to the loaded structure rather than assessed as a set of isolated dimensions.
Four geometry groups deserve different reasoning
1. Wall-thickness distribution
An average wall thickness can hide circumferential variation. In an ideal isotropic thin plate or shell, bending rigidity contains a cubic thickness term:
D = Et3 / [12(1 − ν2)]
where E is elastic modulus, t is thickness and ν is Poisson’s ratio. A simplified sensitivity check shows the scale: if one local region is 5% thinner while material properties and boundary conditions are unchanged, its idealized bending rigidity ratio is 0.953 ≈ 0.857—about 14% lower. A 5% thicker region gives 1.053 ≈ 1.158—about 16% higher.
This is not a flexspline stress or life calculation. Real behavior includes cup curvature, teeth, contact, residual stress and nonlinear assembly. The calculation explains why a small thickness deviation should not automatically be dismissed as a small stiffness deviation. A full thickness map is more informative than a few independent caliper readings.
2. Diaphragm-to-boss transition
The transition changes load path and local curvature. Radius, profile, surface condition and thickness continuity act together. If a process leaves a blend that is dimensionally inside a broad profile zone but has a local slope break or machining mark at the high-stress region, a single radius callout may not describe the relevant geometry. Conversely, tightening the radius tolerance without evidence may add cost without improving fatigue.
A defensible control links the measured transition profile to the design stress model. The comparison should use the same datum definition and section locations. Where fatigue evidence identifies a narrow critical band, inspection density should be concentrated there instead of distributed uniformly across low-sensitivity surfaces.
3. Rim roundness, runout and axial form
The toothed rim is intentionally deformed by the wave generator. Free-state roundness still matters because it defines the starting geometry, but a single best-fit-circle result can lose lobe information. Two parts can share the same peak-to-valley value while one has a two-lobe pattern aligned with the design deformation and the other has a higher-order pattern caused by clamping, heat treatment or grinding support.
Store the polar form trace or harmonic content, not only the final number. Alignment between the form pattern, wall map and tooth datum can reveal whether a local stiffness variation is likely to enter the installed deformation.
4. Datum relationships
The boss, diaphragm, cup wall and tooth system form one functional chain. Measuring each feature in a convenient local setup can create four individually acceptable reports without proving their relationship. The inspection strategy should define how the mounting interface establishes the axis, how the cup wall is sampled without being forced, and how the tooth geometry is located to the same functional reference.
Measurement force can create the error being measured
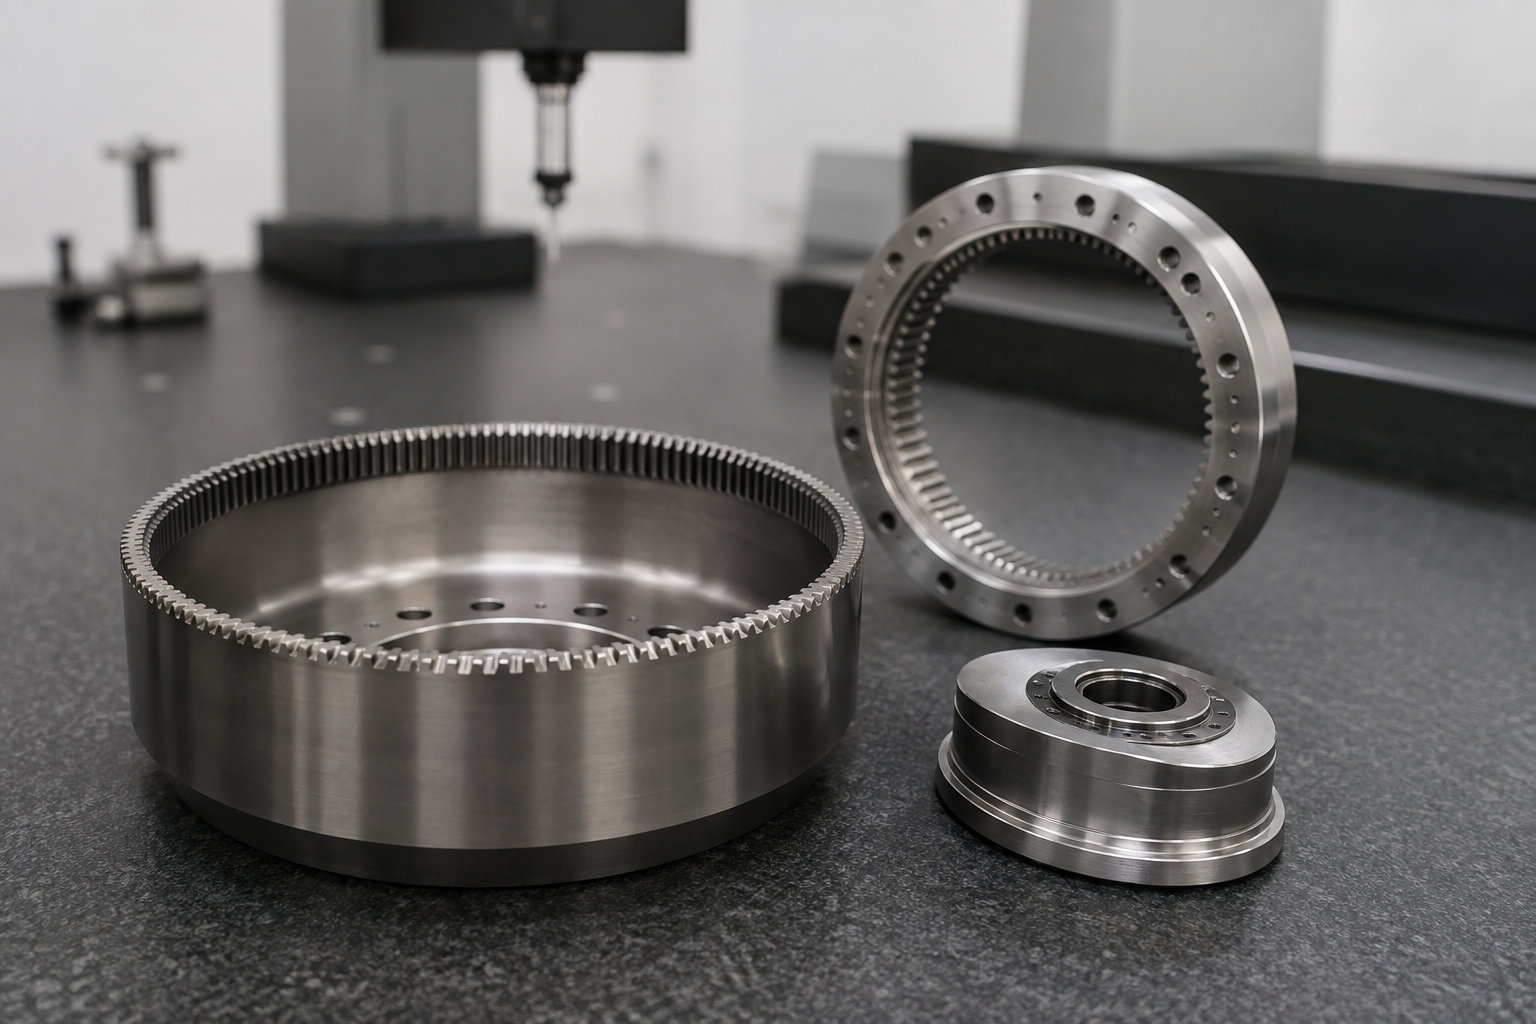
A thin cup can move under chuck pressure, probe force, gravity or a poorly distributed support. Repeatability under one fixture is not sufficient if the fixture imposes the same deformation every time. A useful measurement-system study therefore varies the variables that could distort the result:
- orientation relative to gravity;
- support position and number of contacts;
- clamping or seating force;
- probe force and scan direction;
- temperature and soak time;
- part removal and complete re-fixturing.
If the measured two-lobe pattern rotates with the fixture rather than with the part, the setup is a stronger cause than the machining process. If the result follows the part after re-fixturing and agrees across a low-force method, it is more likely to represent actual form. This experiment should happen before process engineers adjust tool offsets to chase a fixture-induced shape.
Connect free-state geometry to installed deformation
The next step is not to measure every production part under torque. It is to qualify which free-state measurements predict the installed state. A development study can use a representative set of parts spanning the observed geometry range:
- Create a circumferential wall-thickness and form map in a low-force free-state setup.
- Record the transition profile and surface condition at design-identified critical sections.
- Install the specified wave generator using a controlled assembly procedure.
- Measure the installed ovalization, displacement or accessible strain at registered angular positions.
- Compare the measured field with the design model and strain-gauge locations.
- Run representative load or life testing on specimens selected to challenge the edges of the geometric range.
The angular registration is essential. A thin region at 40 degrees cannot be correlated with strain at 220 degrees unless the physical locations and assembly orientation are traceable. Serial identity alone is not enough; the measurement coordinate system must travel through the experiment.
A practical evidence matrix
| Manufacturing feature | Free-state evidence | Functional evidence | Possible confounder |
|---|---|---|---|
| Circumferential wall variation | Registered thickness map | Installed deformation and strain map | Material or heat-treatment variation |
| Transition profile | Dense profile plus surface condition | Model sensitivity and strain near the transition | Residual stress or local decarburization |
| Rim form | Polar trace and harmonic pattern | Contact pattern, transmission behavior or loaded form | Fixture-induced lobing |
| Boss-to-tooth datum chain | Common-coordinate measurement | Assembly alignment and load distribution | Assembly seating error |
The matrix prevents a common reasoning error: seeing a correlation between one dimension and early failures, then treating that dimension as the sole cause. A thickness deviation may correlate with a heat-treatment lot, surface condition or assembly force. The experiment needs enough independent variation to separate these explanations.
When tighter machining is the wrong corrective action
If the model and strain measurements show low sensitivity to the observed geometric variation, tightening the machining tolerance may consume capacity without increasing life. The actual problem may be material cleanliness, heat-treatment distortion, residual stress, shot-peening coverage, lubrication, assembly damage or tooth contact. Manufacturing accuracy cannot compensate for an incomplete failure analysis.
The opposite can also occur. If fatigue cracks consistently start near a transition and measured strain increases with a registered profile or thickness feature, then the manufacturing variable has functional evidence behind it. The corrective action might involve tool-path support, stock distribution, intermediate stress relief, grinding support, transition finishing or an upstream design change. The evidence determines which lever is justified.
Engineering conclusion
A flexspline dimension becomes a fatigue variable only when a causal chain connects the measured geometry to installed deformation, local stress and representative life. The most efficient control plan is not the one with the largest number of dimensions. It is the one that measures low-force geometry in a functional coordinate system, challenges the installed state, and concentrates control on features proven to influence the stress field.
The simplified cubic thickness calculation is a sensitivity warning, not a life model. The published stress studies use particular flexspline geometries and loads, so their numerical results must not be transferred to a different reducer. For a real order, the design model, material condition, assembly procedure and duty cycle define the acceptance evidence. Without those inputs, a precise free-state inspection remains only the first link.
Sources and Method
- Li, “Diaphragm Stress Analysis and Fatigue Strength Evaluation of the Flex-spline,” 2016 — theoretical, finite-element and strain-gauge evidence for diaphragm stress and fatigue evaluation.
- “Stress Analysis of Cup Type Strain Wave Gear,” JSME — analytical and experimental evidence for stress in the cup-type structure.
- “Stress of Flexible Spline in Harmonic Drive,” JSME — strain measurement and stress-location evidence.
- “Tooth Effects on Assembling Bending Stress of Flexible Tooth Rim in Harmonic Drive” — assembly bending-stress context.
The three-state evidence chain and thickness sensitivity example are original engineering analyses. They are deliberately bounded and must be validated against the actual design model and load spectrum.