A CNC spindle-load display is an indirect view of what the spindle drive or motor is doing. Depending on the control and machine, it may represent current, estimated torque, power or a value scaled against a rated operating region. It does not directly measure cutting force at the tool, and the same percentage does not necessarily mean the same torque, power or remaining capacity on another machine or at another spindle speed.
Spindle load is most useful as a relative process signal: compare the same machine, program, tool, material and speed range against a known normal cycle. A sudden step, a rising trend or a new periodic pattern can then reveal that something changed. The display points to a question; it rarely identifies the cause by itself.
What the load number may represent
The spindle motor produces torque, and torque at rotational speed corresponds to mechanical power. The drive measures electrical quantities and the control converts them into the value shown to the operator. How that value is calculated, filtered and scaled is controller- and machine-specific.
FANUC’s Smart Load Meter, for example, can show current output and torque together with spindle speed, motor temperature, available machining time and motor characteristic curves. An older Haas electrical service manual describes its load meter as a percentage of rated continuous spindle-motor power and notes a slight display delay. Those definitions apply to the cited implementations; other controls may scale and filter the display differently.
The motor’s available torque and power also change across its speed range. An 80% reading at low speed can represent a different operating point from 80% at high speed. Gear range, acceleration, spindle orientation and auxiliary losses can change the observed value without a matching change in chip load.
Build a baseline before interpreting a spike
A useful baseline has two parts.
First, observe the spindle without cutting. Record the load at the relevant speed after the machine has reached its normal thermal condition. This captures the background contribution from the spindle, drive, bearings, belt or gearbox and any speed-dependent losses. A high or changing no-cut load deserves mechanical or drive-side investigation before the cutting process is blamed.
Second, record a known-good cutting cycle. Use the same program section, tool, holder, material, stock condition, workholding, coolant and spindle-speed range. Note when the tool enters, reaches steady engagement and exits. A single peak value loses this timing information; a trend or recorded trace is more useful.
If the controller does not export a trace, the operator can still note repeatable values at the same program blocks. The goal is to learn what normal looks like on that machine and operation.
How to read common load patterns
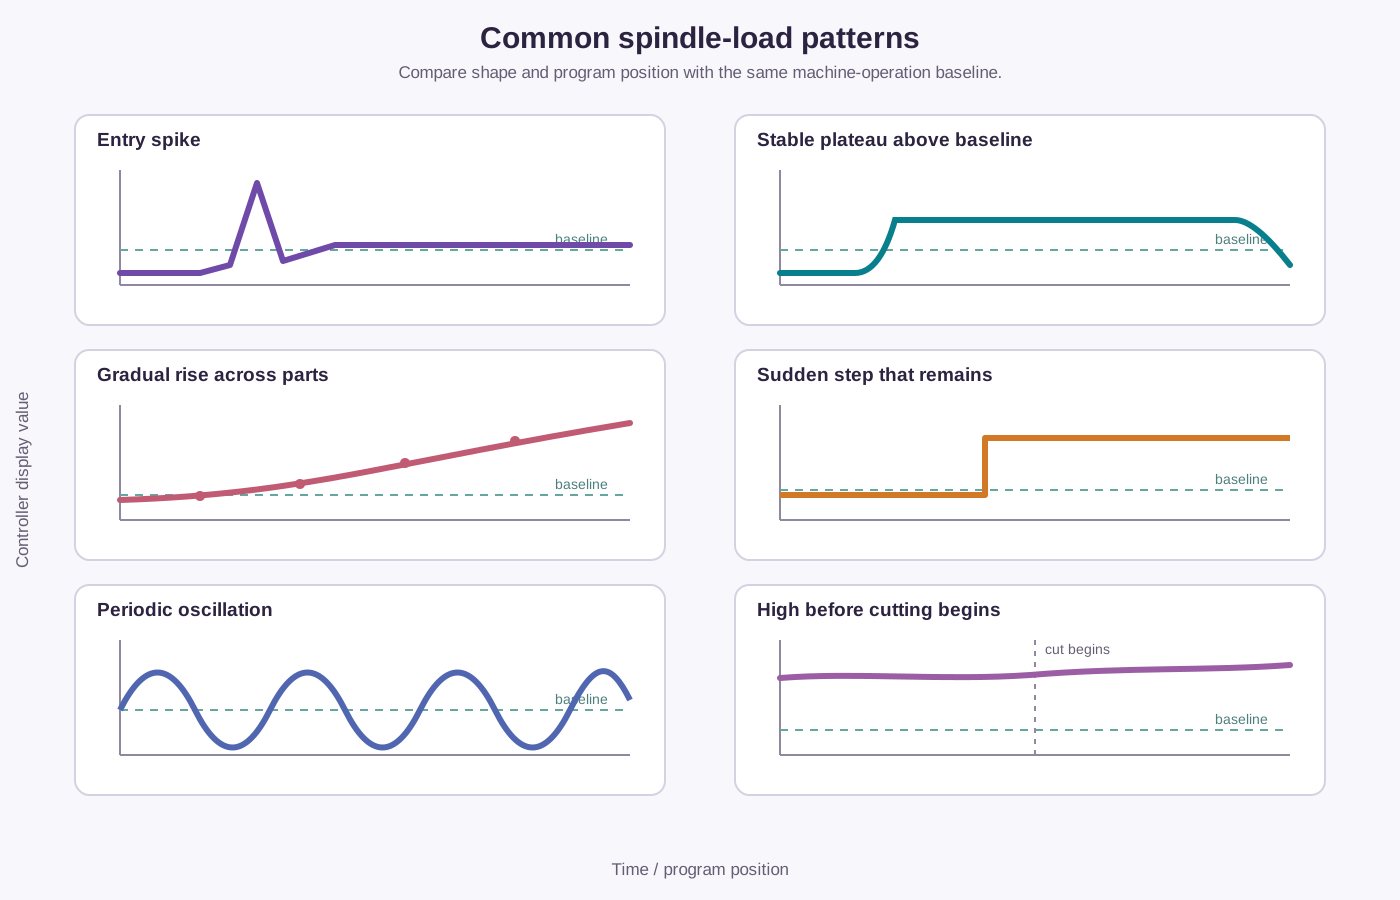
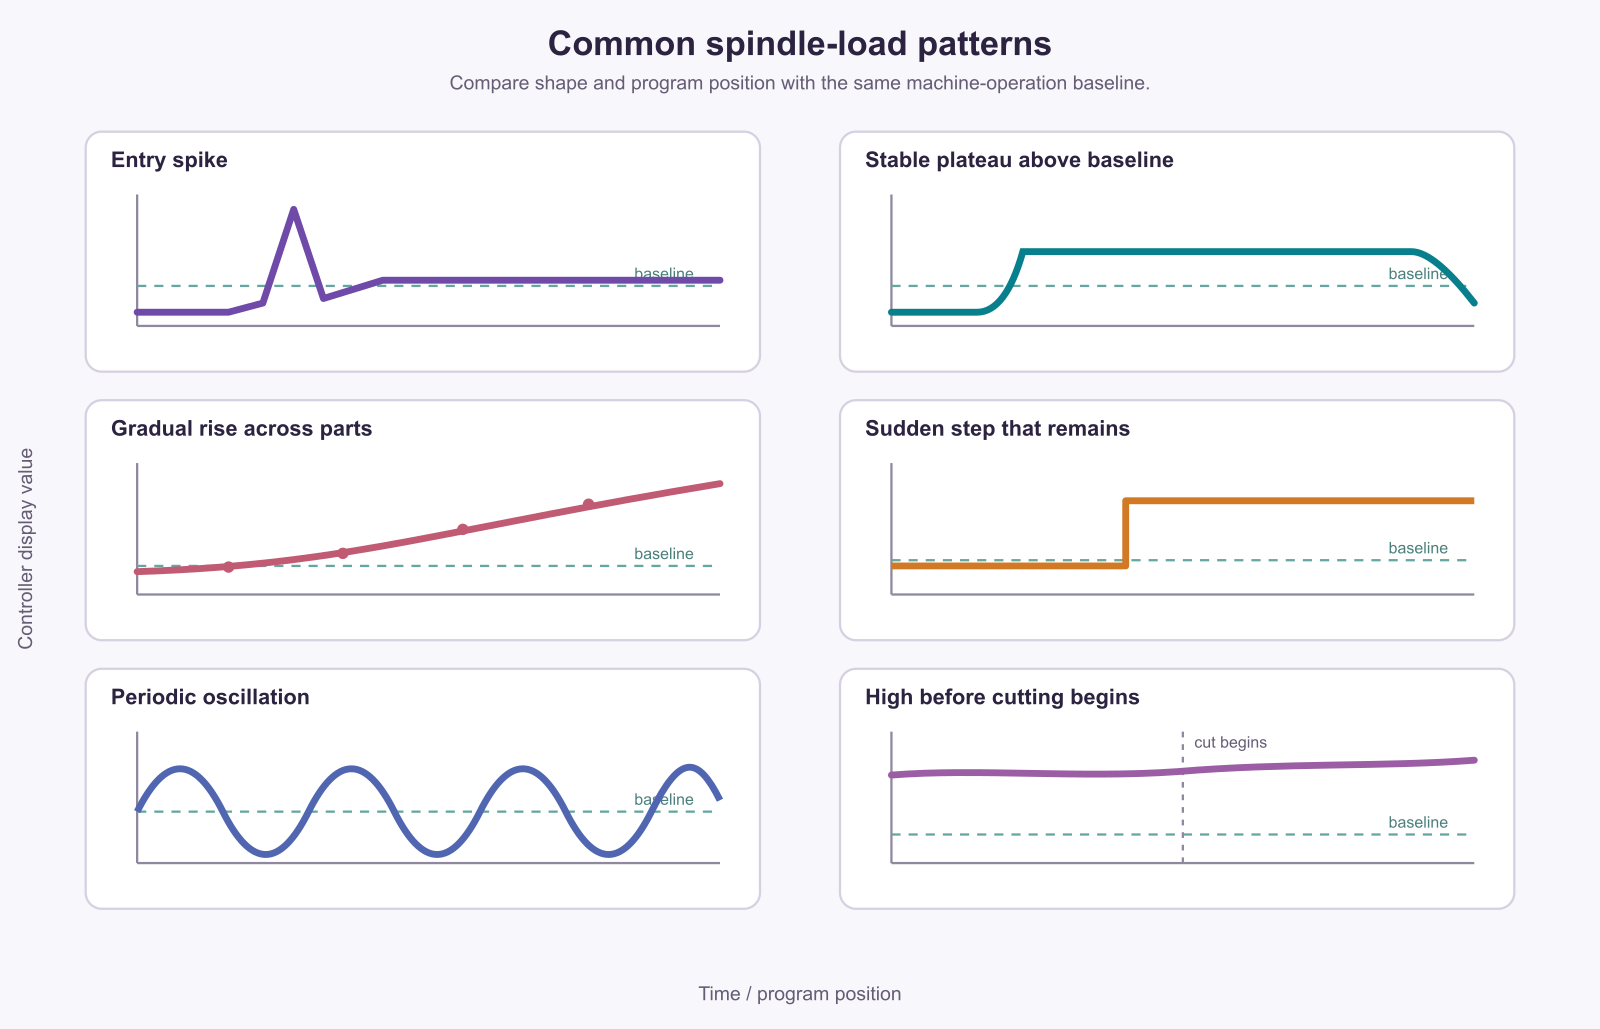
| Observed pattern | Possible explanations | What to check next |
|---|---|---|
| Brief spike at entry | Abrupt engagement, excessive entry feed, corner engagement or stock variation | Program block, entry path, actual stock and tool edge |
| Stable plateau higher than the baseline | More engagement, changed material, a duller tool or restricted chip evacuation | Material/stock, chip form, tool wear and coolant delivery |
| Gradual rise across parts | Progressive wear, built-up edge, thermal change or accumulating chips | Edge images, dimensions, surface trend and no-cut load |
| Sudden step that remains | Chipped edge, changed insert seating, stock change or drive/mechanical change | Stop if necessary, inspect the tool and compare spindle-only load |
| Periodic oscillation | Interrupted engagement, runout, chip recutting, chatter or programmed variation | Frequency relative to spindle rotation, flute passing and toolpath events |
| High load before the tool touches | Spindle, bearing, belt, gearbox, lubrication or drive-side condition | Warm-up state, commanded speed, sound, vibration and maintenance data |
A pattern can have several causes. A worn tool and harder stock can both raise the steady load; runout and interrupted cutting can both create periodic variation. Use the trace to narrow the investigation, then confirm with chips, tool inspection, dimensions, surface condition, sound, vibration or maintenance checks.
What spindle load can tell you reliably
Whether the same operation has changed
When the machine, speed range and program segment remain the same, a repeatable load shift is evidence that the combined process changed. It can help identify the part number, tool-life point or program block where that change began.
Whether a specific part of the cycle is demanding more drive effort
Entry, full engagement, cornering, drilling breakthrough and chip-packed sections may have different signatures. Matching the load trace to program position is more informative than reading the maximum percentage after the cycle finishes. In cross-hole drilling, for example, load can help locate the breakthrough event, while deburring and flow-path-cleanliness evidence must still be gathered separately.
Whether a trial moved the process in the expected direction
If a change to engagement, feed, tool geometry or chip evacuation reduces the abnormal pattern while chip form, surface and dimensions remain acceptable, the load signal supports the result. Chip form, surface and dimensions remain separate quality checks.
Research has used spindle motor power and current signals to study process state and tool wear. A 2025 Procedia CIRP paper, for example, analysed longitudinal and face turning under defined experimental conditions. A 2023 Machines paper also examined motor-current features for turning-tool wear. These studies support the use of drive signals as process indicators within the tested machines and operations; a raw display percentage is not a calibrated wear measurement.
What the display cannot tell you by itself
- Cutting force at the edge. Motor-side load includes drive losses and dynamic effects, and it does not separate tangential, radial and axial cutting forces.
- Tool wear in physical units. Load may correlate with wear in a qualified process, but material, engagement, chips and temperature can produce similar changes.
- A safe percentage for another machine. The scale, motor curve, duty rating and control logic differ by machine.
- Part quality. Confirm size, surface, burr condition and tool integrity with their own checks, even when load is low and stable.
- The cause of a spike. The signal shows combined resistance at the drive; diagnosis needs other evidence.
Why both high and low readings can mislead
A productive roughing cut may intentionally use a high share of the spindle’s permitted operating region. Whether it can continue depends on the manufacturer’s torque/power curve, short-time and continuous ratings, speed, motor temperature and machine limits. A brief high reading may be permitted where the same reading held continuously is not.
Low load can mean an efficient light cut, but it can also mean that the tool is rubbing, one flute is not engaged, the programmed feed is too low or the display lacks resolution at that scale. Increasing feed simply to reach a preferred load percentage reverses the logic. Cutting conditions should be set from the tool, material, engagement and required result, then checked against machine limits and the observed process signal.
A practical monitoring routine
- Read the machine and control documentation to learn what the displayed value represents and which duty limits apply.
- Record no-cut load at the relevant speed and thermal state.
- Capture a known-good cycle and mark entry, steady cut, transitions and exit.
- Compare only equivalent tools, material, stock, workholding, coolant and program blocks.
- When the trace changes, inspect the chip, edge, part and spindle-only condition before naming the cause.
- Set any warning limit from qualified process history and machine documentation, not from a percentage copied from another CNC.
If the signal is to stop a machine automatically or predict tool failure, the qualification burden is higher. The detection method must be tested against real failures and normal variation so that it does not stop healthy cuts or miss damaging ones. A manually observed trend and an automatic protection system are not the same level of control.
A load trace becomes useful only with context
CNC spindle load tells you how hard the spindle drive appears to be working according to that machine’s measurement and scaling. Its strength is comparison: the same operation on the same machine can reveal when the process departs from its normal pattern.
Interpret the number with spindle speed, motor characteristics, cycle position and no-cut load. Then confirm the suspected cause with the tool, chip and part. Used this way, spindle load is a practical process signal. Treating it as direct cutting force or as a capacity reading transferable between machines can create confident but incorrect decisions.
Sources and Method
- FANUC, “Supporting the Displaying of Spindle Motor Characteristics Charts,” June 2023 — official description of Smart Load Meter output, torque, speed, temperature and available-time displays.
- Haas Automation, Electrical Service Manual, Rev. H, January 2010 — a machine-specific example of load-meter scaling and display delay.
- “Process Analysis and Tool Wear Monitoring with Spindle Motor Power and Current Signals in Longitudinal and Face Turning,” Procedia CIRP 133, 2025 — experimental evidence for process and wear analysis using drive signals.
- Machines 11(8), 781, 2023 — experimental research on spindle-motor-current features and turning-tool wear.
The pattern table is a guide to follow-up checks. Definitions, filtering and duty limits must come from the documentation for the actual control and machine.